Obtaining and preparing geographic data
Inputs for the Sewer network module
To be able to use the Sewer network module, 4 geographic layers are required:
WWTP: vector layer containing all locations considered as potential discharge points (existing wastewater treatment plant or possible project location), type: point.buildings: vector layer containing the buildings to be connected, type: point (building centroids).The number of inhabitants per building must be indicated via a population attribute.roads: vector layer indicating the roads that can be used for connection, type: line.DEM: raster layer (.tif, .asc, .vrt) of the digital elevation model for the area of interest.
Note
Vector layers can be .shp or .gpkg.
If you already have these 4 layers, you can go directly to the page Creating a scenario for the centralized/decentralized question. If not, continue here for some tips and explanations on obtaining and preparing the required geographic data.
For the WWTP layer, the simplest way is to Create a new layer, point type, and edit it to indicate all possible discharge point locations (1 point = 1 possible discharge point).
For the other layers:
Tip
Define the project Coordinate Reference System (CRS) from your DEM layer and create your vector layers in this CRS.
In a French context (mainland and overseas territories)
DEM: raster downloadable by department from the IGN Geoservices website25 m DEM: BD ALTI® 25M
5 m or even 1 m DEM: RGE ALTI®
roadsetbuildings: layers downloadable by department from the IGN Geoservices website BD TOPO®.
Tip
To access roads and buildings at the scale of your study area (in French context) rather than the entire department, you can install and use the BD TOPO® Extractor.
Steps:
Install the plugin via the QGIS plugin manager.
Draw a rectangular area on the map to extract.
Select the
BâtimentandTronçon de routelayers.
Attention
The building layer obtained will be polygon type, not point type. It must therefore be converted using one of the Population modules integrated in Elan.
In an international context
DEM(Digital Elevation Model): the DEM is characterized by its acquisition resolution (30 m, 12.5 m, 10 m, 5 m, 1 m are the most common)
The finest is the DEM resolution, the more relevant are the outputs of the Sewer module. Ideally, a 5 m resolution or less will be used.
Note
The availability of DEM with resolution finer than 30 m varies from one territory to another. We highly suggest to check if 10 m or 5 m DEM data are available in you local context. If not, use a 30 m DEM (commonly available) but keep in mind that it will impact the outputs of the Sewer network module (overestimation of pumping stations).
Tip
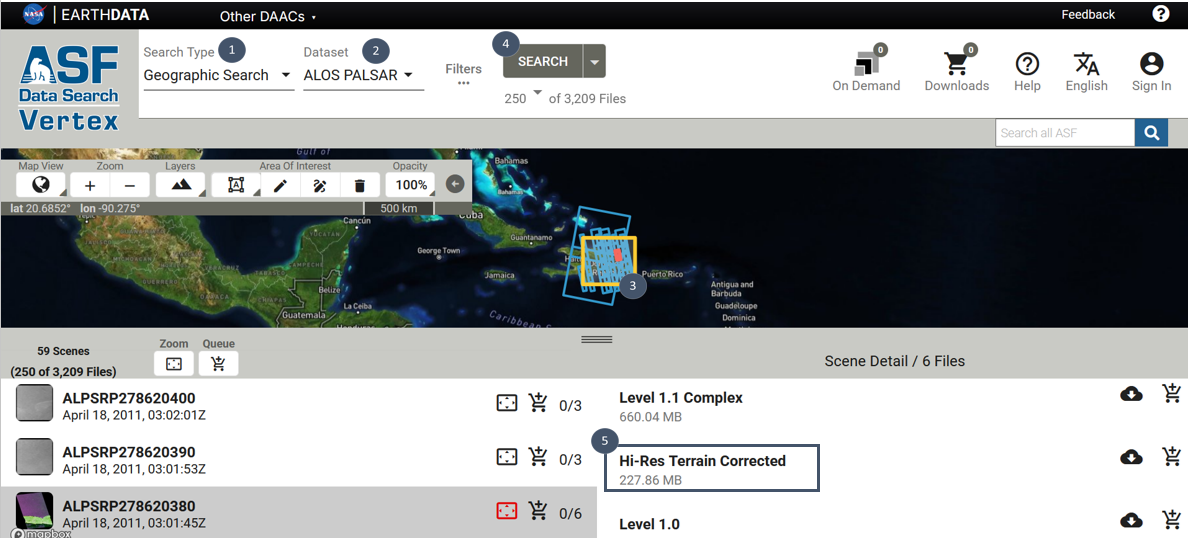
If you do not have access to DEM finer than 30 m, you can check the ASF Data Search website at the following address : https://search.asf.alaska.edu/#/ and follow the indicated steps to try to find a 12.5 m DEM tile covering your area.
Select Geographic Search for the Search type (marker 1).
Select ALOS PALSAR for the Data Set (marker 2).
Indicate your area location on the map (marker 3, yellow square).
Click on SEARCH (marker 4).
Among the suggested tiles on the left, check if there is one where a file High-Res Terrain Corrected can be downloaded (marker 5).
If that is the case, you will have to create an account (email and password) to download the tile.
roadsetbuildings: the Elan Roads and buildings module allows you to extract OpenStreetMap roads and buildings data for a defined area.
Attention
The buildings layer obtained will be polygon type, not point type and has no population attribute. You will need to use one of the Elan Population modules to get the format required by the Sewer network module.
Note
If your area of interest is located in the Southern Hemisphere, Open Buildings can be an interesting alternative to OpenStreetMap for the buildings. For more details: https://sites.research.google/gr/open-buildings/.
Using the Roads and Buildings, Population and Snap on roads modules
Roads and Buildings module
The Roads and Buildings module allows extraction of road and building entities located within a user-defined area (polygon layer). The extraction is performed from OpenStreetMap , which contains cartographic data on a global scale. OpenStreetMap is an open, collaborative tool.
Note
The quality of OpenStreetMap data is not uniform all over the world : it may be lower quality compared to national GIS data (less buildings reported for example) as well as equivalent quality. In the last case, the use of the Roads and buildings module can sometime be a save of time compared to national data (download, post-processing).
Good to know : a very slight discrepancy in terms of georeferencing can characterize data extracted from OpenStreetMap.
Using the module
1. Search for elan in the Processing Toolbox and select Roads and Buildings.
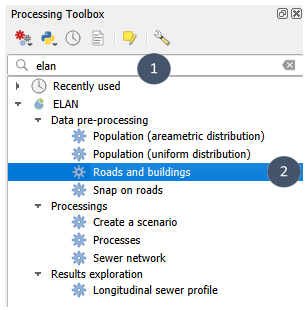
2. Specify the polygon layer that defines the extraction area (marker 1), tick Reproject layers to the project’s CRS (marker 2), then run (marker 3).
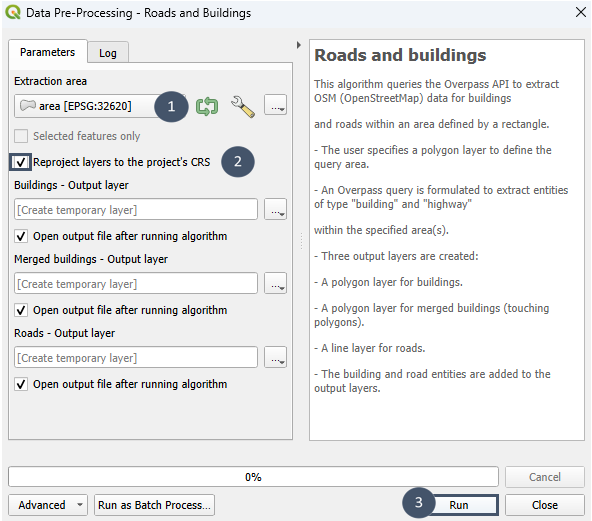
3. After executing the module, you will have three outputs:
Buildings: polygon layer with the buildings as defined in OpenStreetMapMerged Buildings: polygon layer obtained after merging adjacent buildingsRoads: line string layer with the roads as defined in OpenStreetMap
Building layers can be used as inputs for the Population modules.
Road layer can be used as input for the Sewer network module.
Tip
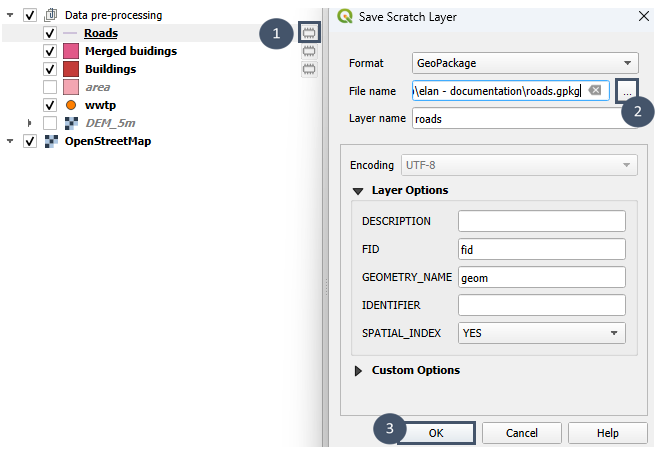
When you run the module, you can keep the default option Create temporary layer for the three outputs and only save those you need or those that best match your knowledge of the field and the issue involved.
For example:
Population modules : Population (uniform distribution) et Population (areametric distribution)
The Population modules allow to assign a number of inhabitants to each building of your polygon layer via a population attribute and to reduce each building to one point (its centroid). They differ from one another in the distribution method (fixed or variable number of inhabitants per building). According to your need, you can use either one or the other of the Population` modules.
Population (uniform distribution) module
The Population (uniform distribution) module allows to assign to each building the same number of inhabitants (mean number of inhabitants per building).
Using the module
1. Search for elan in the Processing Toolbox and select Population (uniform distribution).
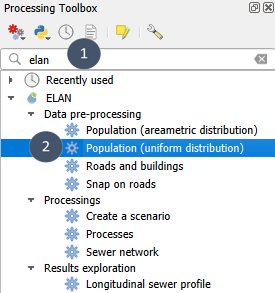
2. Select the building layer (marker 1), specify a mean number of inhabitants per building (marker 2), set an output file (marker 3), then run (marker 4).
Attention
The building layer must be polygon type.
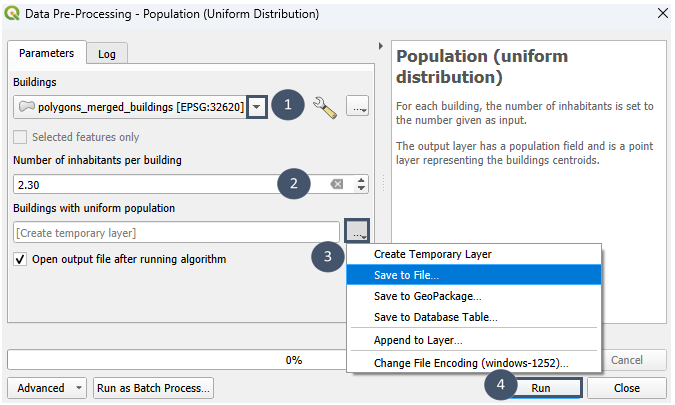
3. After running the module, you will have a point layer with the centroids of the buildings in the area. The same number of inhabitants is associated to each centroid (population attribute). It corresponds to the specified mean number of inhabitants per building. At this stage, you can edit the layer and manually adjust this number for some buildings if you want to (apartment building for example).
Population (areametric distribution) module
The Population (areametric distribution) module allows the distribution of a known number of individuals among the buildings of the area. The distribution is done using the surface method, which takes into account building footprint: the larger the building footprint, the greater the number of individuals assigned.
For more information on the distribution method used:
Lwin et al., (2009). A GIS Approach to Estimation of Building Population for Micro-spatial Analysis. Transactions in GIS, 13(4):401-414, doi: 10.1111/j.1467-9671.2009.01171.x
Using the module
1. Search for elan in the Processing Toolbox and select Population (areametric distribution).
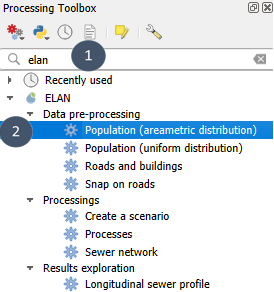
2. Enter a population value (marker 1), select the building layer (marker 2), set an output file (marker 3), then run (marker 4).
Attention
The building layer must be polygon type.
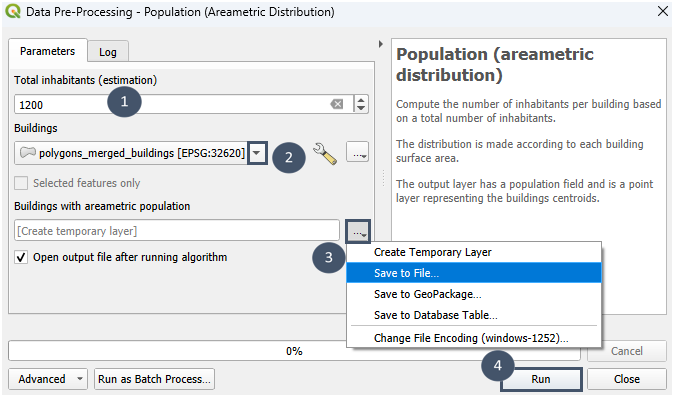
3. After running the module, you will have a point layer with the centroids of the buildings in the area. Each centroid has an associated population attribute that can be accessed in the attribute table of the layer.
Tip
To distribute the population more precisely (for example, by neighborhoods), select the entities of one neighborhood before running one of the Population modules, and after selecting the layer, tick Selected features only.
Repeat as many times as there are neighborhoods in the area. Then use QGIS’s Merge vector layers tool to obtain a single layer (input for the Sewer network module).
Snap on roads module
The Snap on roads module allow to snap centroids of the buildings to connect on the nearest road (at a vertex) within a maximum distance specified by the user (40 m by default).
This optional step has 3 major advantages:
reduce the number of centroids to consider during preliminary sizing of the sewer network as centroids snapped on a same vertex are merged, which leads to a reduction of the computation time
pre-design only main arteries of the sewer network
focus preliminary sizing on public infrastructures (pipes and lifting / pumping stations)
Using the module
1. Search for elan in the Processing Toolbox and select Snap on roads.
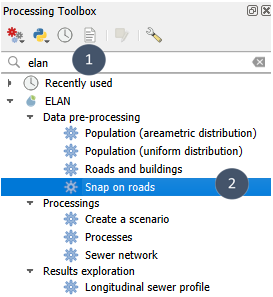
2. Select the road layer (marker 1) and the building layer (marker 2), specify the field corresponding to population (marker 3), if needed adjust the default value for maximum distance authorized for snapping (marker 4), then run (marker 5).
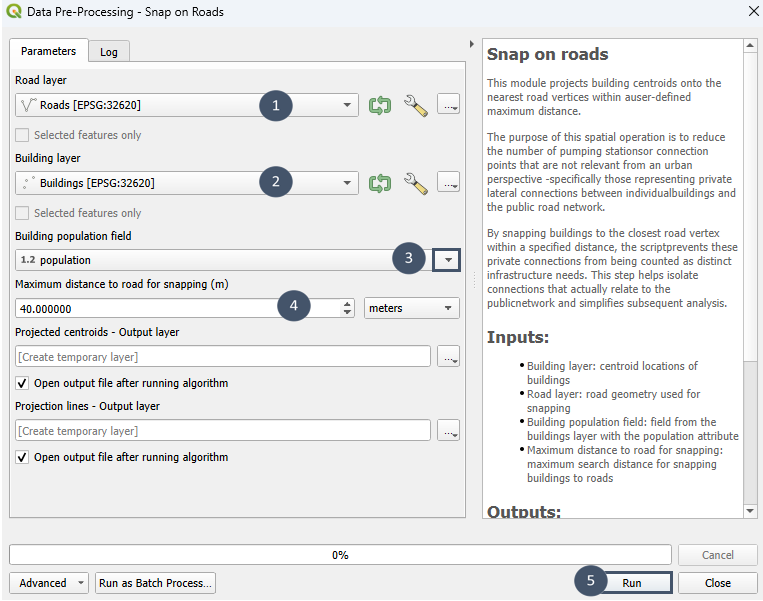
3. After running the module, you have two temporary outputs that you can then save as explained above
Snapped centroids: point layer with the building centroids snapped on roads (for those matching the specified maximum distance to roads). Each centroid is characterized by 2 attributes:layer typecount the number of buildings represented by this centroid,
population the total number of inhabitants at this centroid.
Projection lines: line string layer with the projection lines between the initial centroids and the ones after snapping on roads
Centroid layer can be used as inputs for the Sewer network module.
The lines layer is available only to help the user in understanding and enable him to consider adjustments (addition of road segments, deletion buildings, change the maximum distance to road authorized for snapping for example).
Inputs for the Hydraulic module
Hint
This section is under construction.